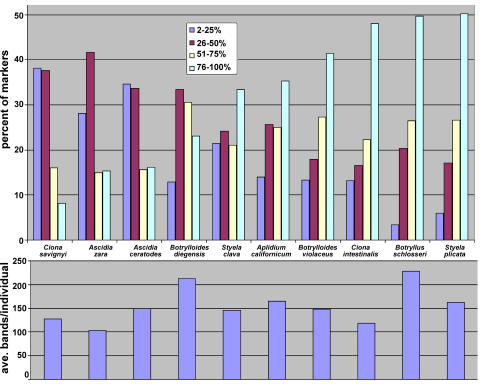
Figure 3. Graphical representation of ascidian genetic similarity.
The top panel shows the percentage of the total markers for each population that are shared by indicated percent of the individuals sampled. The bottom panel shows the average number of bands per individual for the same data set and in the same species.

