Figure 5.

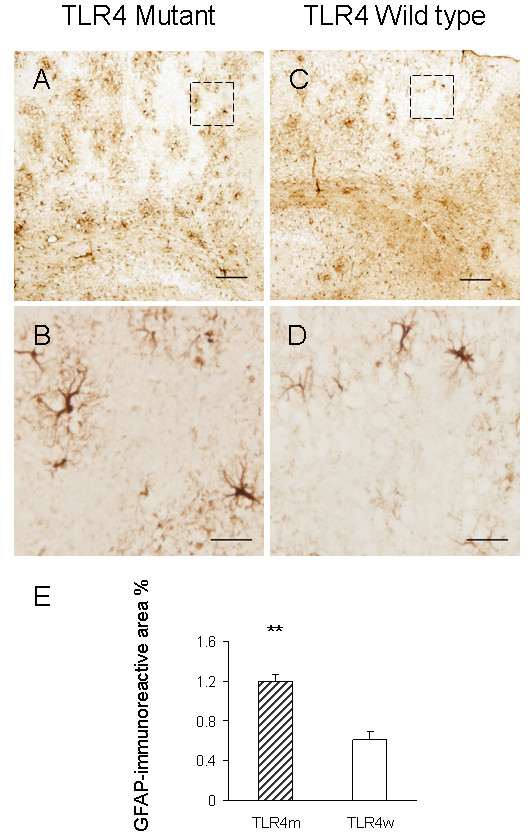
Reactive astrocytes in TLR4m AD mice increase compared to TLR4w AD mice by immunohistochemistry. The frozen sections of cerebral cortices from TLR4m (A and B) and TLR4w (C and D) AD mice were stained with anti-GFAP antibody. Scale bars are 50 μm in A and C, and 10 μm in B and D. The middle images (B and D) are a high magnification of the areas indicated by the squares in the top images (A and C). GFAP immunoreactive area percentages of TLR4m and TLR4w AD mice were shown as a bar graph (means ± SE, **P < 0.001) (E). Approximately 15 fields of the cerebral cortex (0.5 to 1 mm2each, using a 10× objective and 1× eyepiece lens) from 4 – 5 coronal brain sections, each separated by more than 240 μm interval, from each mouse were analyzed. TLR4m and TLR4w represent TLR4m and TLR4w AD mice, respectively.
