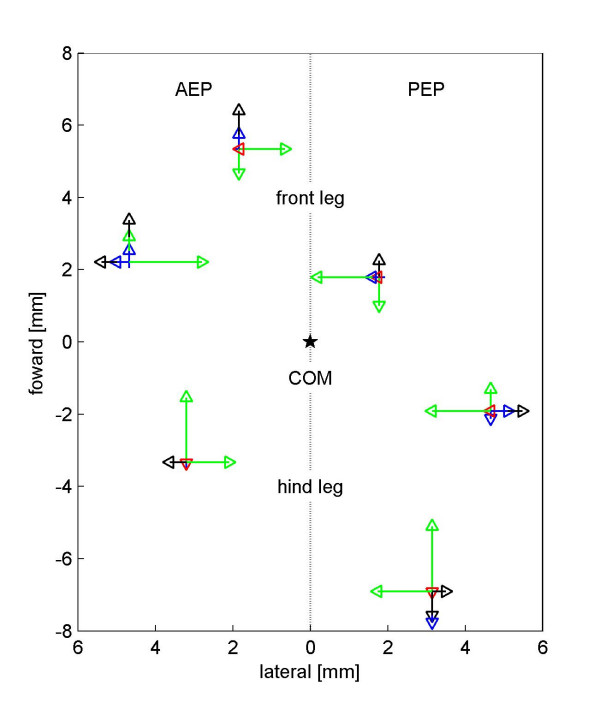
Figure 4.
Influence of the input parameters on footfall geometry during the touch down (AEP) and the lift off (PEP) phase at different inclinations. The influences of speed (blue, per 0.1 m/s acceleration), species (green, from C. fortis to F. pratensis), head width (black, per 1 mm increase in head width), and inclination (red, per an increase of 10° in inclination) are plotted on the mean value of all analyzed runs. Arrows are attached to each other, i.e., if pointing in the same direction, one arrow has its base at the tip of the previous one.

