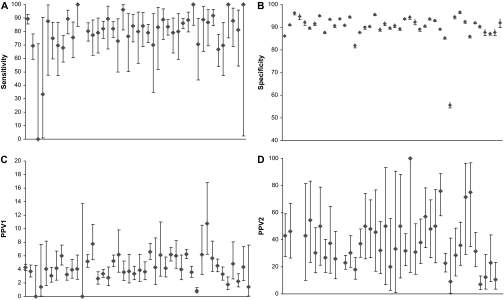
Figure 2.
Screening mammography performance measures for the 44 facilities. A) Sensitivity. B) Specificity. C) Positive predictive value of any additional evaluation (PPV1). D) PPV of referral for biopsy (PPV2). Diamonds indicate mean values; error bars correspond to 95% confidence intervals. The 44 facilities varied statistically significantly in specificity (P < .001), PPV1 (P < .001), and PPV2 (P = .002) but not in sensitivity (P = .99).

