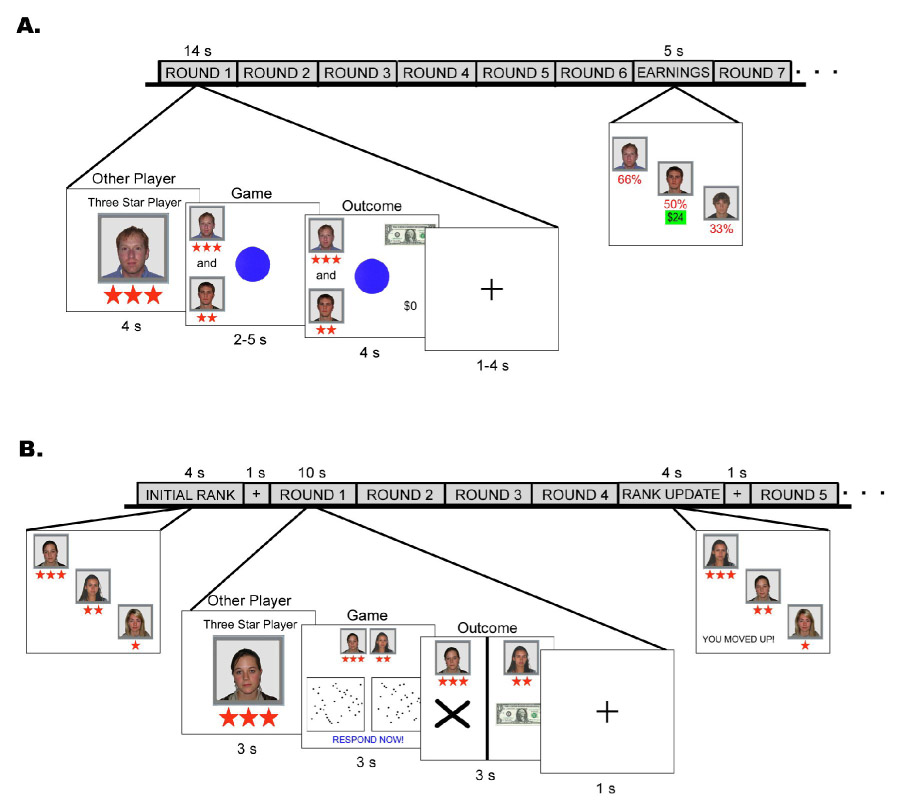
Figure 1.

Schematic diagram of the experimental design. Each round in the tasks consisted of three phases: viewing the other player, playing the game, and viewing the outcomes. (A) In Experiment #1 (stable hierarchy), during the game phase participants pressed a button as soon as the blue circle changed to green. The initial hierarchical rankings did not change throughout the session. (B) In Experiment #2 (unstable hierarchy), during the game phase participants pressed a button to indicate which box contained more dots. The hierarchical rankings were updated throughout the session based on performance.
