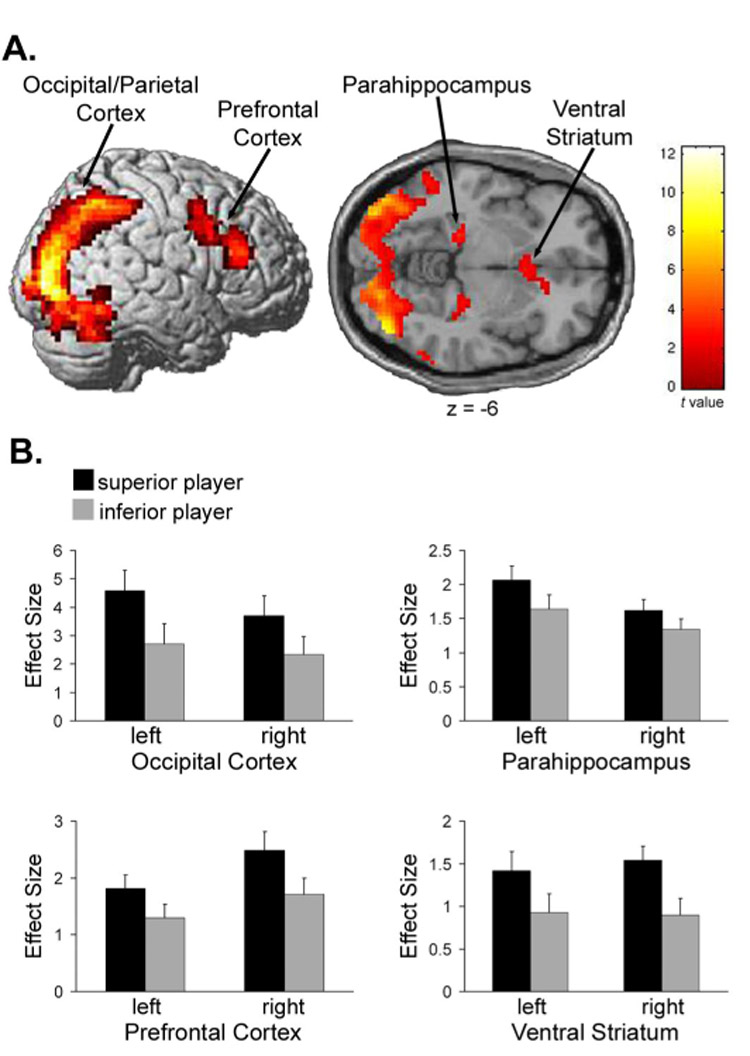
Figure 2.

Significant activations for the contrast, “superior player > inferior player” in Experiment #1 (stable hierarchy). Displayed are (A) significant (P < 0.005, FDR-corrected) activations in occipital/parietal cortex [−24, −96, 9; 42, −81, −6], dorsal lateral prefrontal cortex [−36, 3, 42; 42, 30, 21], parahippocampal cortex [−21, −27, −9; 27, −24, −12], and ventral striatum [−3, 15, −6; 6, 18, −3], and (B) plots of the effect sizes (parameter estimates) when viewing the superior and inferior other player, extracted from the peak voxels in each activated region.
