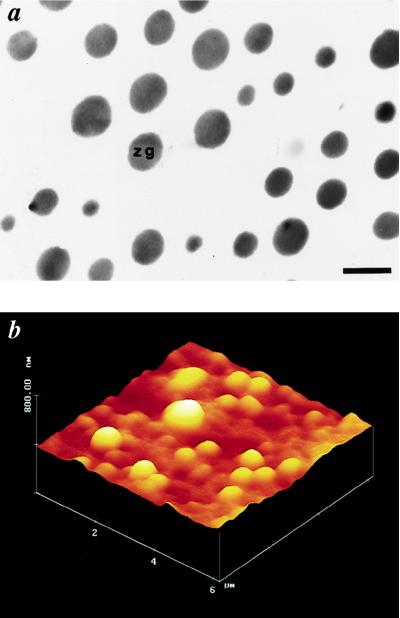
Figure 1.
Isolated ZGs ranging in size from 0.2 to 1.2 μm obtained from rat pancreas as seen by electron and AFM. (a) An electron micrograph of the electron-dense ZGs. Note the purity of the ZG preparation. (Bar = 1 μm.) (b) A three-dimensional AFM image of isolated ZGs adhering to a Cell-Tak-coated mica sheet. Notice the size heterogeneity in the ZG population.

