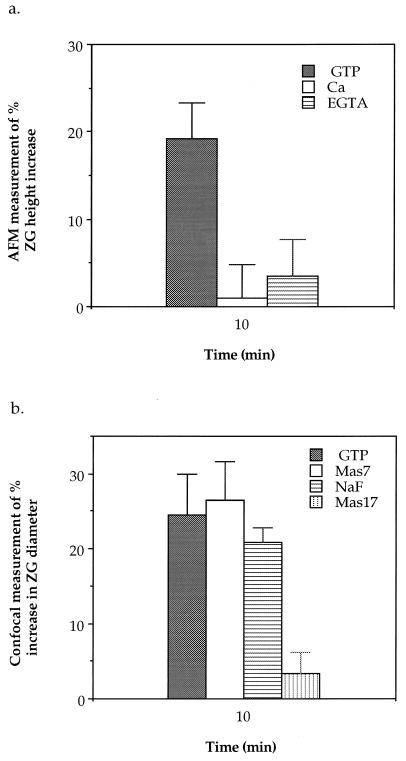
Figure 4.
Change in ZG height and diameter measured by AFM and confocal microscopy, respectively. (a) Increase in the height of isolated ZGs were observed only in the presence of GTP. Analysis of height change in various population of ZGs (n = 14) exposed for 0 minutes and the same ZGs exposed for 10 minutes to 20 μM GTP, 100 μM Ca2+, or 200 μM EGTA is graphically depicted. A significant increase in ZG height was observed only in the GTP-exposed groups. Paired Student’s t tests, with P < 0.001, were used. (b) Similar increases in ZG diameter as measured by the confocal microscope were observed in ZGs exposed to GTP, Mas7, and NaF. Change in diameter of various population of ZGs (n = 10), exposed to 20 μM GTP, 20 μM Mas7, or 100 μM NaF for 10 minutes is shown. A significant (P < 0.001) increase in ZG diameter at the 10-minute time point over the 0-minute time point is seen. Twenty micromolars of Mas17 (control) had no effect on ZG size. Values represent one of three representative experiments.

