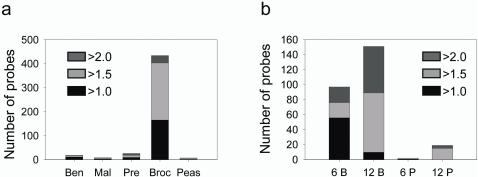
Figure 3. Effect of dietary intervention on gene transcription.
a, Number of probes that differ between GSTM1 positive and null genotypes (P≤0.005, Welch modified two-sample t-test) in TURP tissue from benign (Ben) and malignant (Mal) prostates, and TRUS-guided biopsy tissue from volunteers at pre-intervention (Pre), post 6 months broccoli-rich diet (Broc) and post 6 months pea-rich diet (Peas). b, Number of probes that differ between pre-intervention TRUS-guided biopsy samples and after 6 months broccoli (6B)-, 6 month pea (6P)-, 12 month broccoli (12B)- and 12 month pea (12 P)-rich diets (P≤0.005, Welch modified two-sample paired t-test). Shading correspond to different fold cutoffs applied. See Table 2 for full details of probe numbers, P-values and median false discovery rates.

