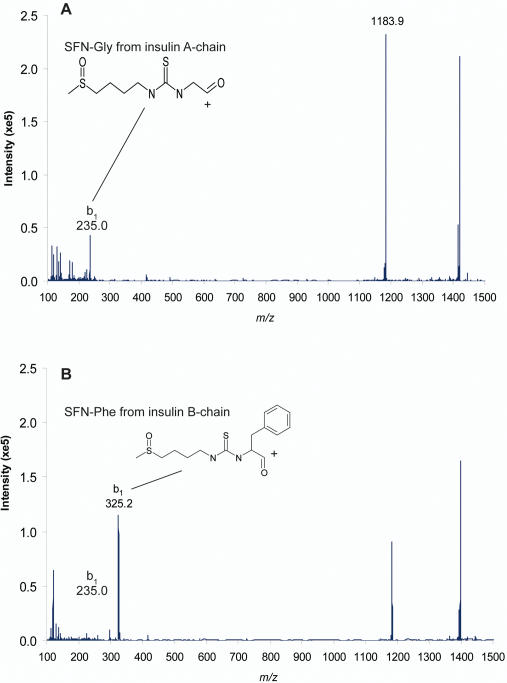
Figure 5. Enhanced product ion (EPI)-MS spectra of the two insulin-SF conjugates.
MS2 product ion spectra of (A) 6.46 min and (B) 7.08 min retention time peaks from LC-MS analysis of human plasma incubated with bovine insulin and 50 µM SF for 4 h at 37°C. In (A) and (B) m/z 1183.9 corresponds to insulin-SF MH5 5+ and in (A) m/z 235.0 corresponds to Gly-SF, the N-terminal amino acid of insulin A chain and in (B) m/z 325.2 corresponds to Phe-SF, the N-terminal amino acid of insulin B chain.

