
FIGURE 2.
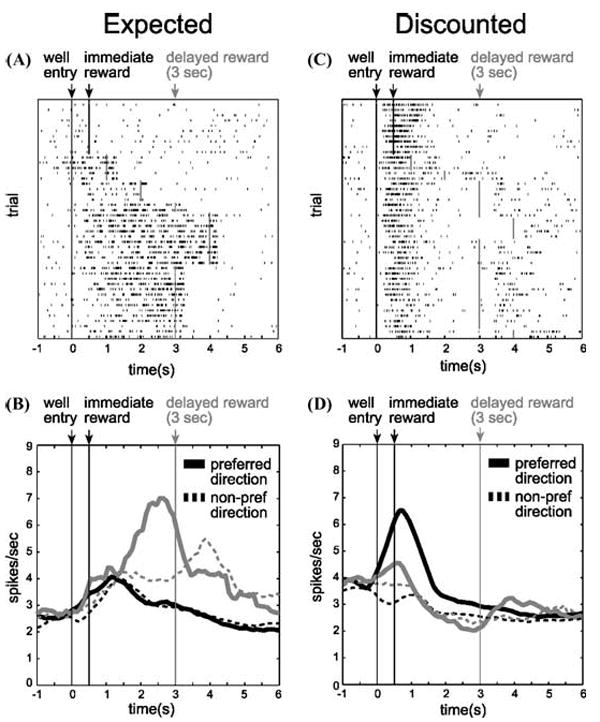
(A) Single cell example of an expectancy neuron. Activity is plotted for the last 10 trials in a block in which reward was delivered in the cell’s preferred direction after 500 msec (black) followed by trials in which the reward was delayed by 1 to 4 sec (gray). Each row represents a single trial, each tick mark represents a single action potential and the black/gray lines indicate when the reward was delivered. (B) Population histogram (n = 27) representing firing rate as a function of time during the trial for neurons that fired in anticipation of a reward delayed by 3 sec. Activity is aligned on well entry. Preferred direction refers to the spatial location that elicited the stronger response for each neuron. Black: short. Gray: long. Solid: preferred direction. Dashed: nonpreferred direction. (C) Single cell example of a neuron that discounts delayed rewards (gray), but fires strongly for rewards delivered immediately (black). (D) Population histogram representing firing rate as a function of time during the trial for neurons that fired more strongly after short delays during the reward epoch (n = 65). Conventions are the same as in A and B. “Preferred direction” refers to the spatial location of the well for which higher firing rate was elicited when other variables were held constant (i.e., reward size and delay length). Population activity is indexed to each neuron’s preferred direction to average across cells (adapted from Roesch et al.33).