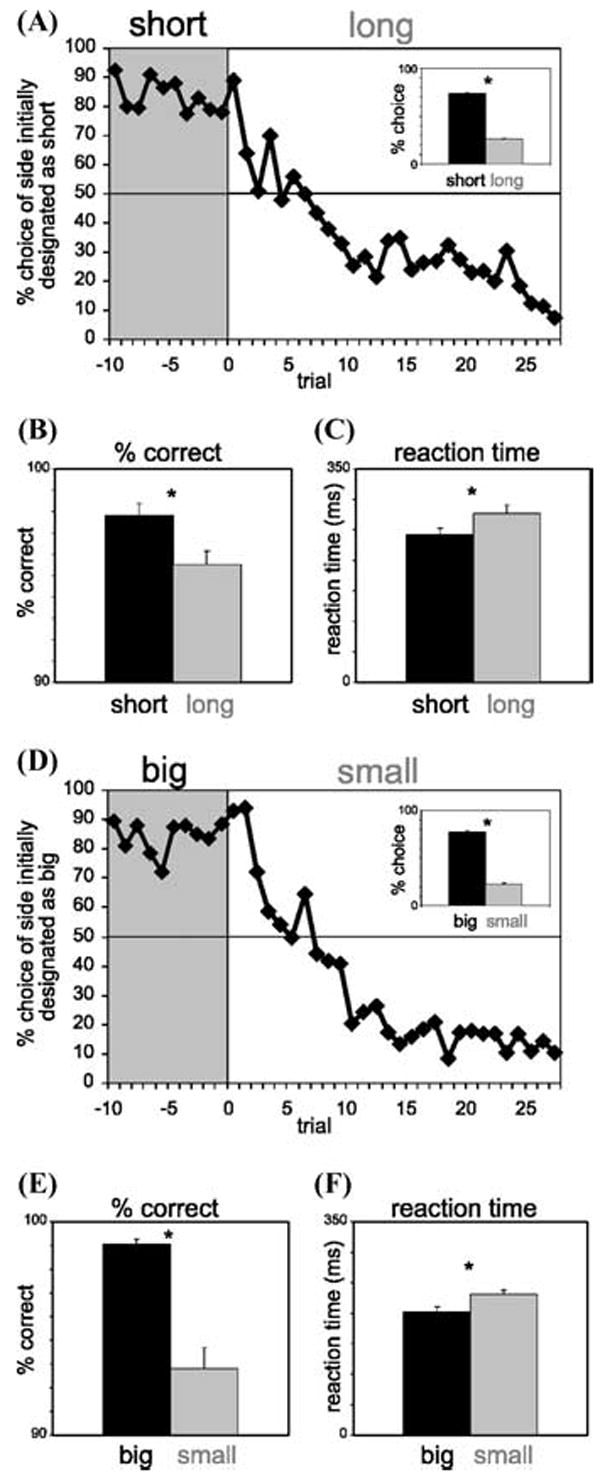
FIGURE 5.

Impact of delay length (A–C) and reward size (D, E) on behavior. (A) Average choice rate, collapsed across direction, for all sessions for trials before and after the switch from short to long. Inset: The height of each bar indicates the percentage choice of short delay and long delay taken over all choice trials. (B, C) The height of each bar indicates the percentage correct (B) and reaction time (C) across all recording sessions in all rats on short-delay (black) and long-delay (gray) forced-choice trials. (D, E) Impact of reward size on the same behavior measures described in (A–C). Asterisks: t-test, P < 0.05. Error bars: standard errors. (adapted from Roesch et al.33).
