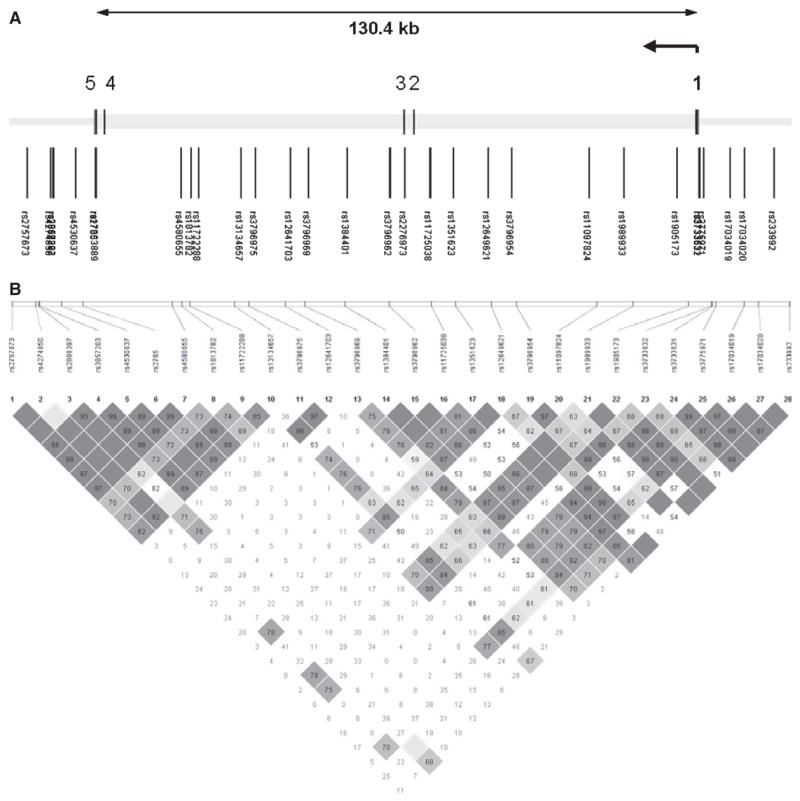
Fig. 1.

(A) Genomic structures of TACR3. The gene structure of TACR3 is based on transcript NM_001059. The direction of transcription and the exons are indicated by arrows and numerical numbers, respectively. The size of the gene is indicated in scale at the top of the figure. (B). Pairwise linkage disequilibrium. Pairwise linkage disequilibrium (D′) estimates among the genotyped SNPs. Darkly shaded boxes have strong evidence of linkage disequilibrium, defined as a pair of SNPs with the one-sided upper 95% confidence bound on D′ of 0.98 and the lower bound above 0.7. Lightly shaded boxes have lower linkage disequilibrium.
