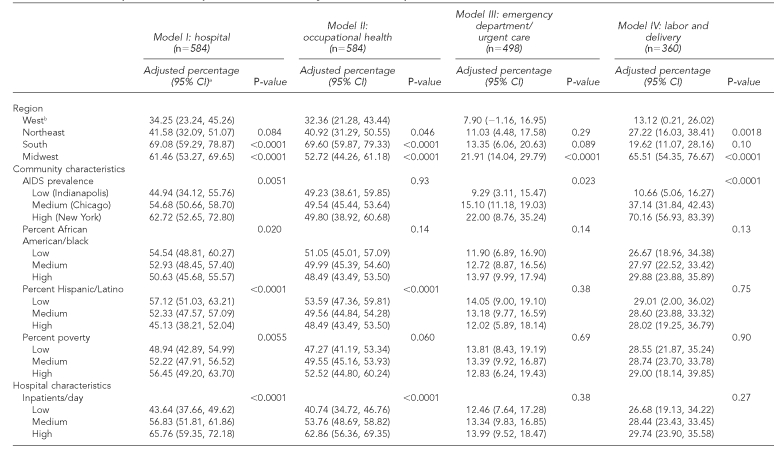
Table 2.
Multivariate predictors of rapid HIV test availability in 584 U.S. hospitals
The percentages have been adjusted for all variables listed in the table. P-values were calculated from the multivariate model after sampling weights were applied. For illustrative purposes, adjusted percentages are presented at meaningful cut-points for continuous census variables (low = 25th percentile, medium = median, high = 75th percentile) and for AIDS prevalence (lowest, medium, and highest prevalence PMSAs, of the 12 selected PMSAs). However, these variables were included in the multivariate models as continuous. Adjusted percentages for all PMSAs are available by request to the first author.
This group was used as the comparison group in the multivariate analyses and the reference category for all calculated p-values.
CI = confidence interval
HIV = human immunodeficiency virus
AIDS = acquired immunodeficiency syndrome
PMSA = primary metropolitan statistical sampling area


