
Fig. (1).
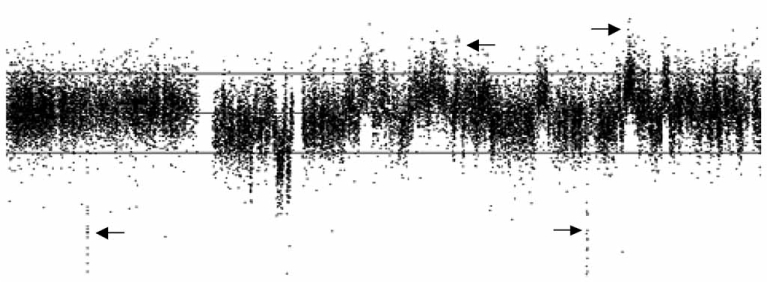
An example of complex chromosome copy number alterations detected by 500K SNP array analysis. This image shows multiple small gains and losses on chromosome 5 including sub-microscopic chromosomal amplifications and deletions (arrows) around 100 Kb in the PC3 prostate cancer cell line. The middle horizontal grey line represents log2 ratio of 0 compared to normal controls; the bottom and upper lines represent log2 ratios of −1 and 1.