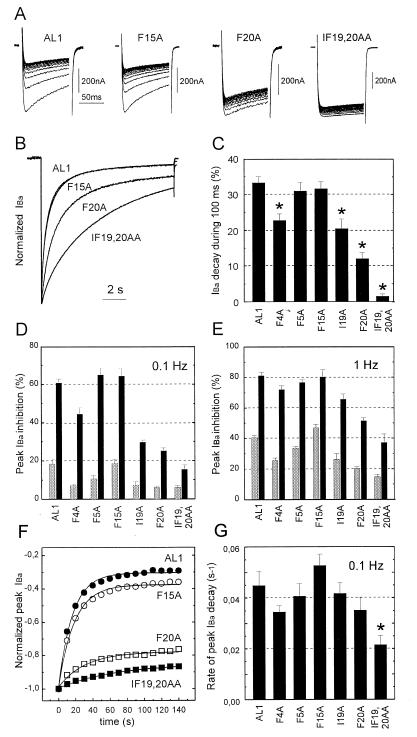
Figure 2.
(A) Use-dependent IBa-inhibition by 100 μM (−) gallopamil of AL1, F15A, F20A, and IF19,20AA. Channel block was estimated as peak IBa inhibition during trains of 15 pulses (100 ms) applied from a holding potential of −80 mV to 10 mV. Note that slowly inactivating mutants are affected less by (−)D600! (B) Normalized control IBa of chimeras AL1, F15A, F20A, and IF19,20AA during 10 sec depolarizing test pulses applied from a holding potential of −80 mV to 10 mV. Traces of AL1 and F15A are superimposed. (C) Comparison of the time course of IBa inactivation of mutants AL1, F4A, F5A, F15A, I19A, F20A, and IF19,20AA (in control) measured as IBa-decay during a 100 ms test pulse from −80 mV to 10 mV (n = 6–9). Oocytes were depolarized to the peak potential of the current voltage relationship (10 mV). Statistically significant acceleration of current inactivation compared with AL1 is indicated by asterisks (*P < 0.05). (D and E) Comparison of the use-dependent IBa block of the AL1 derived mutant α1 subunits as depicted in Fig. 1 B by 100 μM (−)D600. The block of IBa was measured as cumulative current inhibition (in %) during 15 depolarizing pulses (100 ms) after 3 min incubation of the Xenopus oocytes in drug (solid). Peak IBa decay under control conditions (shaded) indicates an incomplete recovery of IBa from inactivation during the train. Test pulses were either applied at a frequency of 0.1 Hz (D) or 1 Hz (E). Bars = mean ± SEM. (n = 3–14). (F) Peak current values of IBa in the presence of 100 μM (−)D600 during a 0.1 Hz pulse train plotted as a function of time. Smooth lines, single-exponential fits to the time courses with time constants of 16.4 sec (AL1), 18.5 sec (F15A), 31.4 sec (F20A), and 65 sec (IF19,20AA). Data are from the experiments shown in A. (G) Mean rate constants of peak current inhibition of the studied chimeras deduced from single exponential fits of the peak IBa decay during trains of 15 test pulses (100 ms) applied at 0.1 Hz. Peak current values were normalized to the first pulse current amplitude. Statistically significant faster rate of peak current decay during a train compared with AL1 is indicated by ∗ (P < 0.05).

