Figure 3.

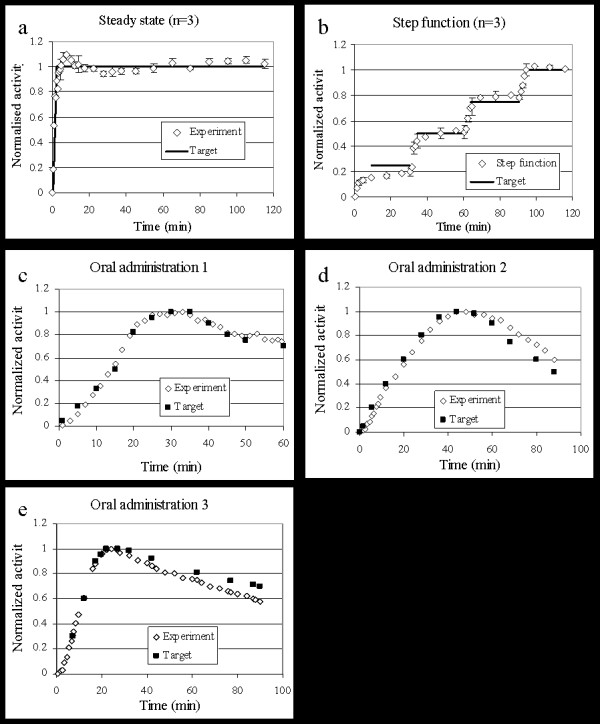
a) Steady state curves (n = 3), b) Step function (4 steady state levels, n = 3), c-e) Simulating uptake after oral administration.

a) Steady state curves (n = 3), b) Step function (4 steady state levels, n = 3), c-e) Simulating uptake after oral administration.