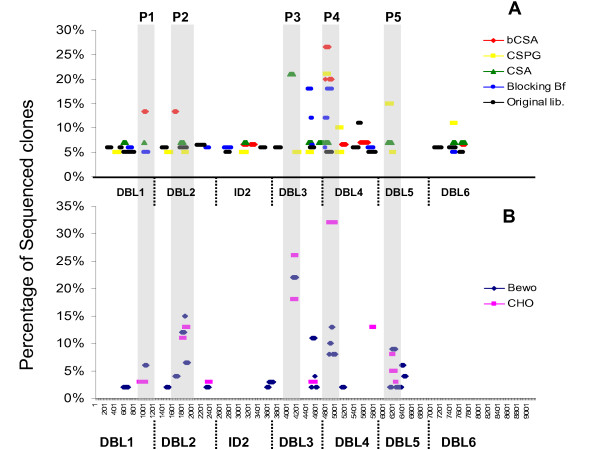
Figure 1.
Frequency of identifed phages sorted according to the identity of the VAR2CSA region and the method of biopanning. The var2csa phage display library was biopanned four rounds on each of the following: biotinylated CSA (A, red); Chondroitin sulfate proteoglycans of human placenta (CSPG) (A, yellow); bovine CSA (A, green); CHO cells expressing CSA on the surface (B, pink) and human placental choriocarcinoma cell line BeWo (B, blue). Control biopannings were done on ELISA plates coated with BSA (A, blue) and the original library was sequenced prior to selection to confirm the presence of sequences belonging to all domains (A, black). For each assay 15 CSA-binding clones were sequenced. Each coloured bar indicates the VAR2CSA sequence expressed by the selected phage on the x-axes and the frequency by which the sequence was detected by sequencing on the y-axes. The length of the coloured bar indicates the length of the VAR2CSA sequence in the selected phage. The VAR2CSA regions most often expressed by the CSA-binding phages are shaded in grey (P1-P5).

