
Figure 2.
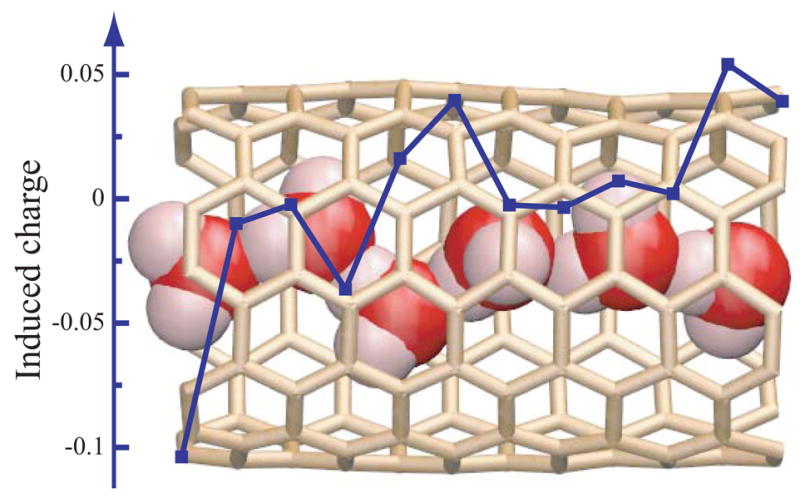
The background is a snapshot taken from a MD simulation of a 6-water-wire (vdW representation) inside a nanotube segment. Water molecules outside the nanotube are not shown for clarity. The overlaying curve plots the total induced surface charges (in squares) of each section of the nanotube.