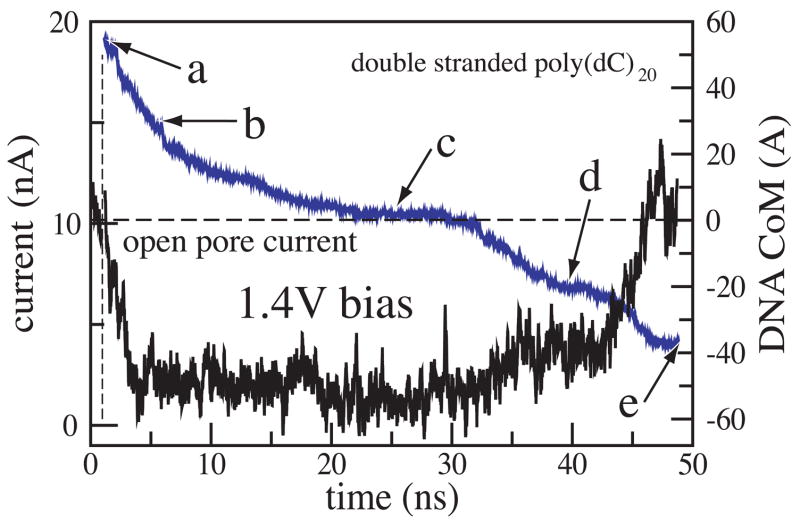
Figure 5.
Simulated recording of the ionic current during DNA translocation through the nanopore. The black trace indicate the total ionic current, which is shown at the left vertical axes. The blue line represents the position of the DNA center of mass relative to the center of the Si3N4 membrane, which is shown at the right vertical axes. The vertical dashed line marks the moment when DNA was placed in front of the pore; the horizontal dashed lines indicates the open pore current. Snapshots from this simulation are shown in figure 4.

