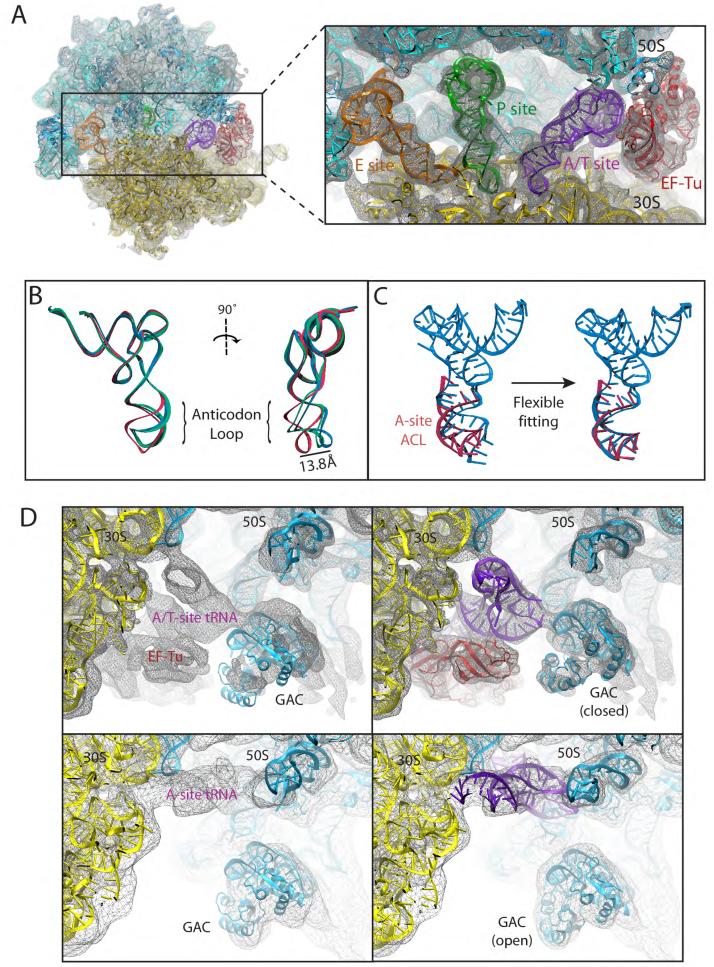
Figure 4.
Fitting into the TC-bound ribosome cryo-EM map at 6.7-Å resolution by means of MDFF. (A) Overview of the all-atom ribosome structure fitted into the 6.7-Å map, with a close view into the decoding center (inset). (B) Conformation of tRNA in the A/T site. The crystal structure from the free TC used as a starting point for the fitting (PDB 1OB2, unpublished data) is shown in red; the A/T tRNA model obtained by applying the MDFF method to the 6.7-Å map is shown in blue; the A/T tRNA model previously obtained using a 9.0-Å map constructed by interpolating two manual fittings of tRNA (PDB 1OB2) is shown in green (Valle et al., 2003). (C) Conformation of tRNA in the A/T site (blue) compared to a partial crystal structure of the A-site tRNA (Selmer et al., 2006) (red). The crystal structure from the free TC used as a starting point for the fitting (PDB 1OB2, unpublished data) is shown on the left; the A/T tRNA model obtained by applying the MDFF method to the 6.7-Å map is shown on the right. (D) Conformational dynamics of the GTPase-associated center. Shown are differences in the conformation of the GTPase-associated center between the TC-bound ribosome (EM map at 6.7-Å resolution, top), and the accommodated ribosome (EM map at 9-Å resolution, bottom). Rigid-body docked structures into the corresponding maps, used as initial coordinates for flexible fitting, are shown on the left; flexibly fitted structures are shown on the right.

