
Figure 1. Structure of the AgrAC–DNA Complex.
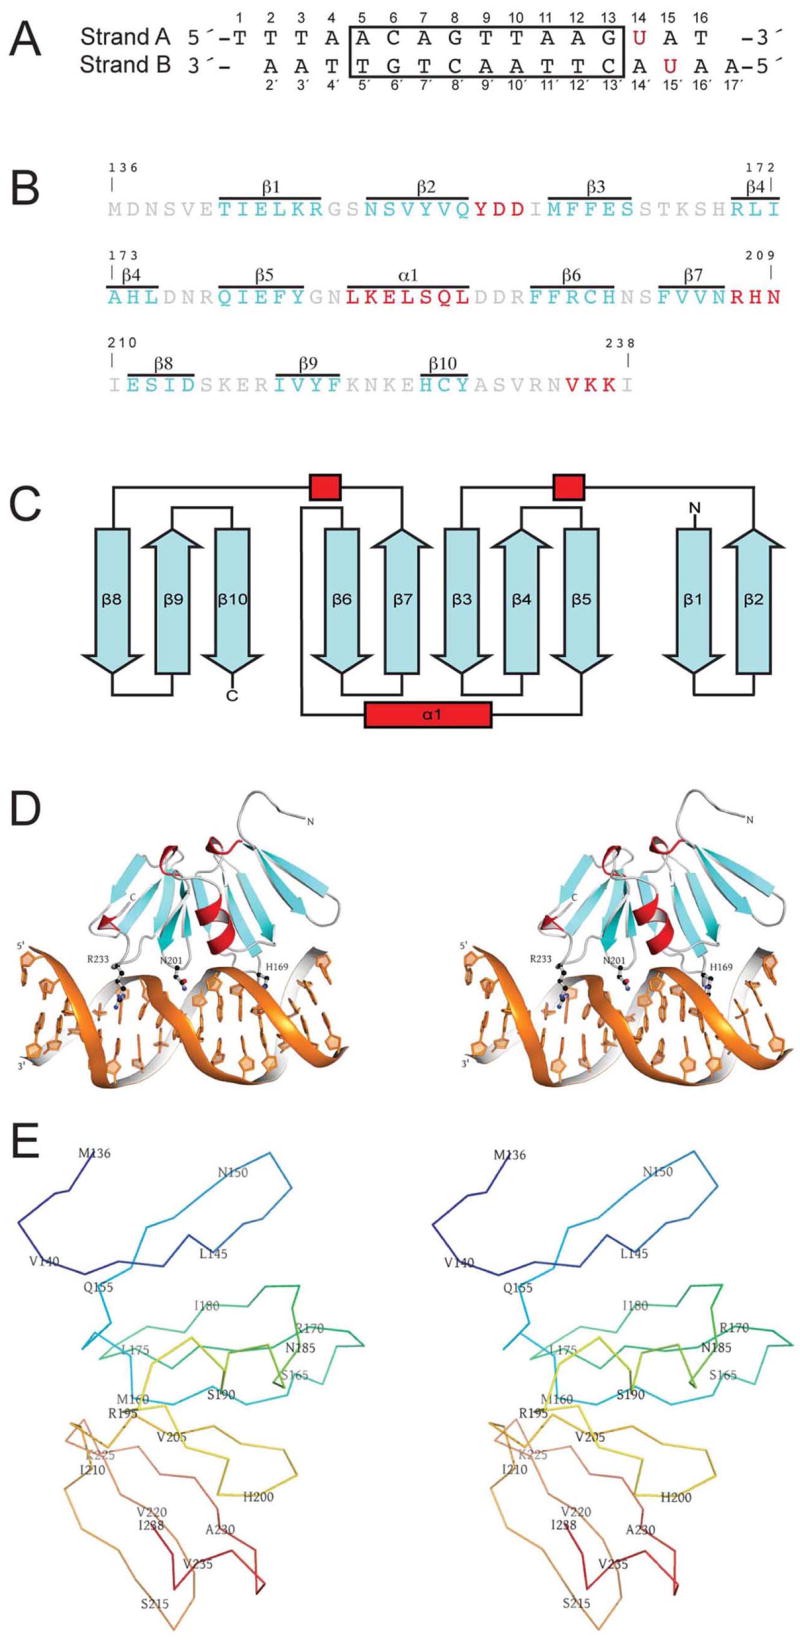
(A) Sequence of the DNA oligonucleotide crystallized in complex with AgrAC. The highly conserved LytTR consensus sequence is boxed. A red U indicates each position substituted with 5′-bromouracil. The coding strand is labeled as Strand A and the non-coding strand as Strand B.
(B) Sequence of the C-terminal DNA-binding domain of AgrA (residues 137–238 and initiator methionine). Loop regions are colored gray, helices are colored red, and strands are colored cyan. The secondary structure elements are indicated above each region.
(C) Topology diagram of AgrAC. Secondary structure elements are colored as described in (B).
(D) A stereo ribbon representation of the AgrAC–DNA complex. AgrAC is shown in an orientation and color scheme similar to that in (B). Residues that make base-specific contacts with the DNA are shown in ball-and-stick representation.
(E) Stereo view of an alpha carbon trace of AgrAC. The chain is color ramped from blue at the N terminus to red at the C terminus with residue numbers indicated at every fifth C α.