
Figure 2. Salt Bridge Interactions in AgrAC.
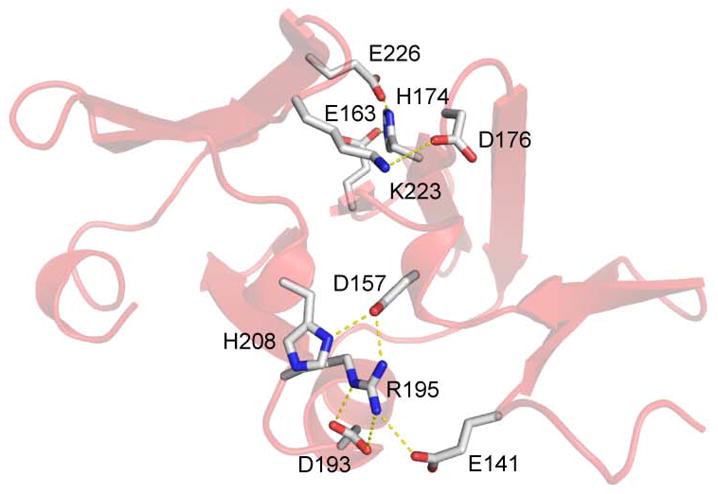
Ribbon representation of AgrAC displaying salt bridges that stabilize the fold. Sidechains of residues involved in salt bridge interactions are shown in stick representation with carbon in white, oxygen in red, and nitrogen in blue. The salt bridges are concentrated on the surface opposite of the surface that contacts DNA.