
FIGURE 2.
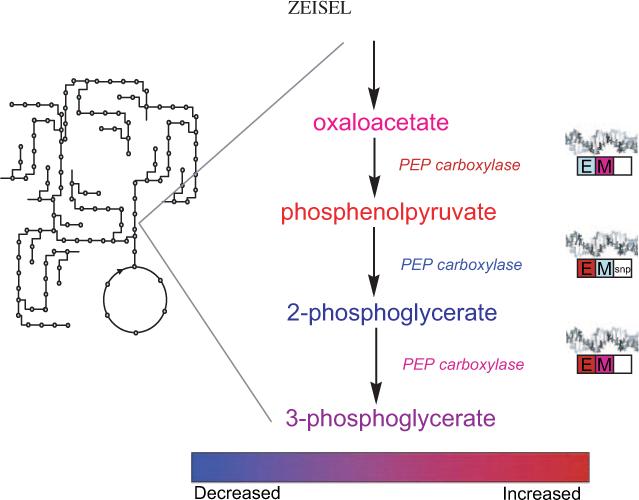
A theoretical example of what the informatics tools may look like that will make nutrigenomics and metabolomics accessible to nutrition scientists and clinicians. After appropriate statistical tests and filtering, data from nutrigenomic, epigenetic, and metabolomic platforms can be overlaid on the metabolic map that we are familiar with. By selecting an area of the metabolic map, the user can zoom in on the region and see a presentation of changes in metabolite concentrations, enzyme activities, and perhaps flux rates with color coding to indicate direction of change. Information on changes in DNA expression (E), gene methylation (M), and gene SNPs also can be presented by using similar color coding. By selecting the metabolite, enzyme, or gene box, an investigator would be able to examine the exact values and variances and perhaps even to examine the raw data. Another level of the informatics program would summarize all of the related changes by pathway and present information on false discovery and significant difference statistics. Finally, a summary of appropriate diet recommendations would be presented.