
Figure 4. Morphology of BM-derived VSELs by ImageStream system.
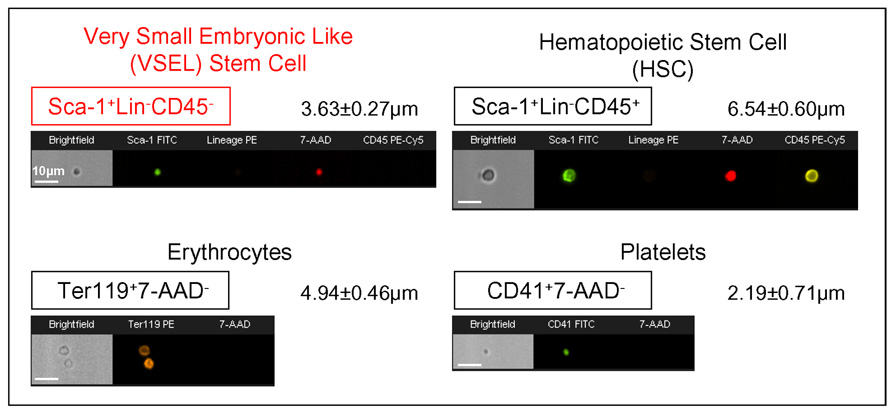
Upper panel shows representative images of Sca-1+/Lin−/CD45− VSEL and Sca-1+/Lin−/CD45+ HSC isolated from murine BM, while the lower panel presents murine erythrocytes and platelets derived from blood. Each population was stained for specific surface markers followed by fixation. Nuclei were visualized with 7-aminoactinomycin D (7-AAD; red). Each photograph presents brightfield image and fluorescence images related to expression of indicated markers and presence of nucleus. Erythrocytes and platelets were identified as anucleated objects (lower panel). The scale bars indicate 10µm. Average size was calculated for each population and is shown as a Mean±SD.