
Figure 1. Regulatory circuit governing biofilm formation.
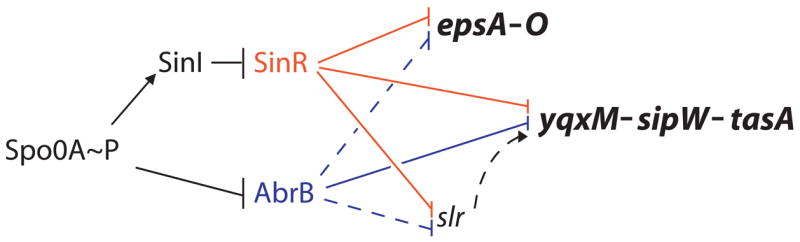
Arrows indicate activation of transcription and T bars indicate repression. Solid lines denote direct regulation and the dashed lines denote cases in which it is unknown if the regulation is direct. Red indicates SinR and its targets and blue denotes AbrB and its targets.