Figure 3.

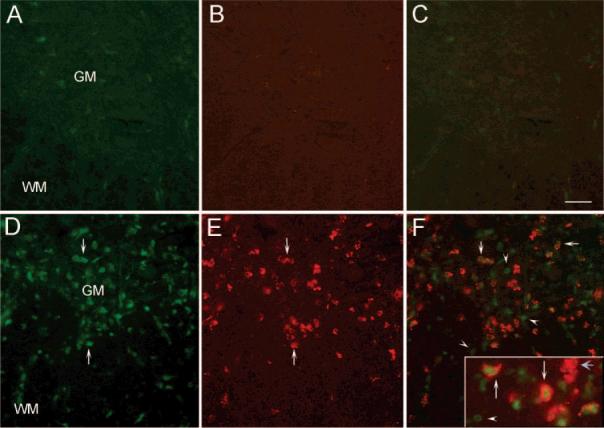
Expression of PA28 in activated microglia. (A) A transverse section of control spinal cord revealed very low PA28 staining only in occasional cells. (B) Labeling of the same section with the ED-1 antibody revealed the absence of activated microglia in controls. (C) The combined picture of PA28 and ED-1 staining. (D) In contrast, a marked increase in cells expressing PA28 was seen in spinal cord sections obtained from EAE rats (arrows). (E) As expected, there was also a noticeable increase in ED-1 positive cells which may either be activated microglia or infiltrating peripheral macrophages (arrows). (F) Combination of the two staining showed co-localization of ED-1 and PA28 immunoreactivity (arrows) indicating induction of PA28 in activated microglia or macrophages. However, there were also PA28 positive cells, which were not ED-1 positive (arrowheads), and ED-1 positive cells which were not PA28 positive (blue arrow in inset). Inset is the high magnification picture of an area in the spinal cord showing the details of the co-localization. N = 3; GM: Gray matter, WM: White matter. Bar represents 100 μm for A–F and 60 μm for inset.
