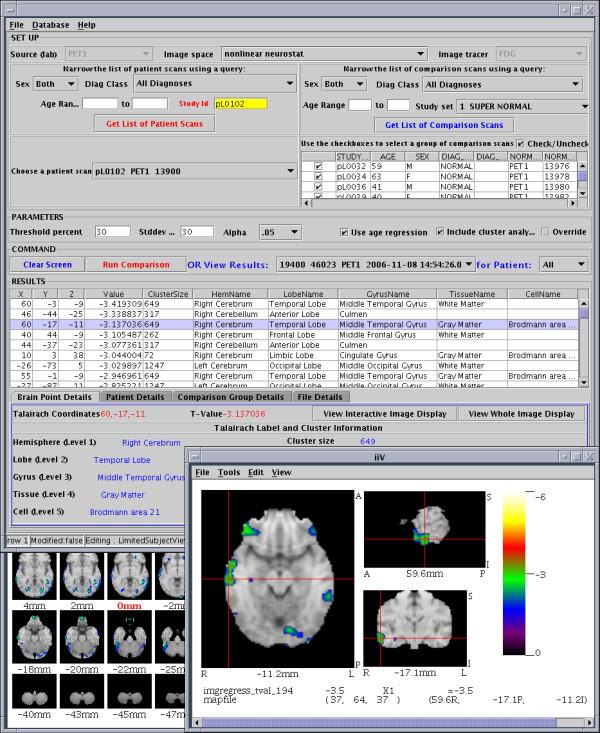
Figure 10.

Oracle database interface tool that automates comparisons between a single subject to a group. The top half of the interface selects the subject, comparison group, and parameters. Results are shown as a list of peak t-values with Talairach locations and labels from the Talairach Daemon located near the middle. iiV interacts with the tool displaying a selected location (highlighted on the results list) in orthogonal views (lower right). Selecting a different result line causes iiV to update and inversely clicking a location over iiV selects the nearest peak in the results list. The tool can also pop up another copy of iiV showing results over all transverse slices (partially visible lower left). Images shown in this figure were warped to a standard space using the Automated PET Activation Analysis Package [17-20] and overlaid on a reference MRI that came with that package.
