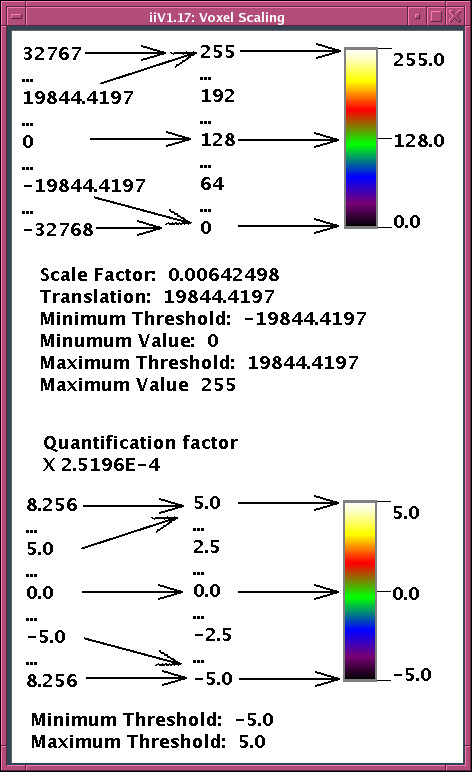
Figure 7.

The top picture outlines mapping short words (16 bit) whose values can range from -32768 to +32767 to color values. This is done with linear scale factors (middle table) that include thresholds mapping values that would fall outside the color range to the ends. Because data words often include a quantification factor, the scaling can also be viewed in terms of quantified values (bottom picture) which may be more user-friendly by having units representing parameters such as t-values.
