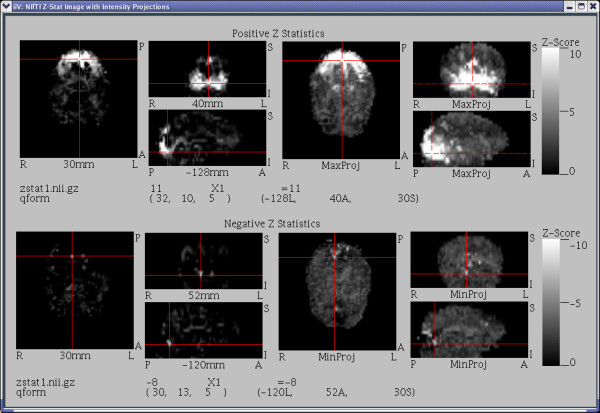
Figure 8.

This figure contains images generated from a NIfTI Z-Stat sample data file downloaded from the NIfTI web site [22]. The top half shows positive Z values with the 3 orthogonal images on the left representing the standard slices and the 3 orthogonal images on the right representing maximum intensity projections. At the bottom of the top half is a show point line displaying the selected voxel location and value. The bottom half shows negative Z values, minimum intensity projections, and the selected voxel location and value for the bottom half. Notice the dashed crosshairs over the right most maximum intensity projections indicates that the maximum intensity along the line perpendicular to each of those views did not occur at the currently selected voxel (the current selection was made over the transverse maximum projection).
