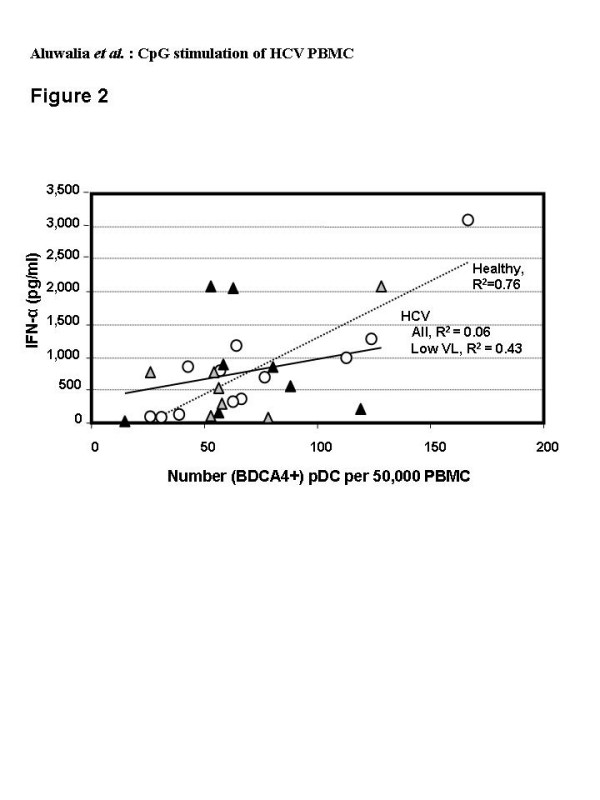
Figure 2.

Flow cytometric analysis of pDC in freshly isolated PBMC from healthy (open circles, n = 12) and HCV-infected (grey or black triangles, n = 15) donors; HCV donors with low viral load at baseline (< 600,000 IU/ml) are indicated by grey triangles. Numbers of pDC counted among 50,000 events by flow cytometry of lineage negative, CD11c negative, HLA-DR+, BDCA4+ cells are plotted against the amount of IFN-α secreted by 1× 10⁶ cells cultured for 48 hrs in the presence of the C-Class CpG at 6 μg/ml. Each point represents the results for an individual subject (average of duplicate assays).
