
Fig. 1.
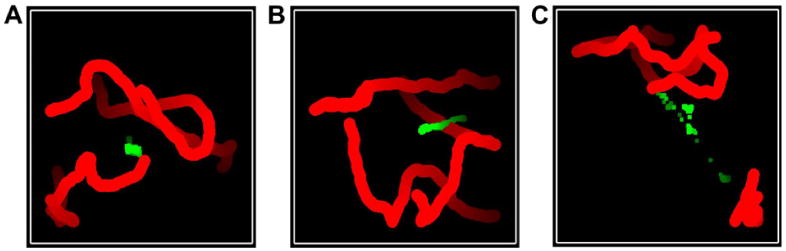
Traces of targets positions and the point of fixation during 3 trials. The trajectories of targets (red dots) and the point of fixation (green squares) are shown in three example 3-target trials (A–C). Distractor dots are not represented in these graphs. Time course of the trial is represented by the brightening of the color, such that the locations of the dots and eye fixation at the beginning of the trial are shown in dark colors and the locations at the end of the trial are shown in bright colors. Typically eye movements followed a pattern of either (A) staying in roughly the same place throughout the trial, (B) pursuing the general motion of the targets, or (C) saccading rapidly between targets.