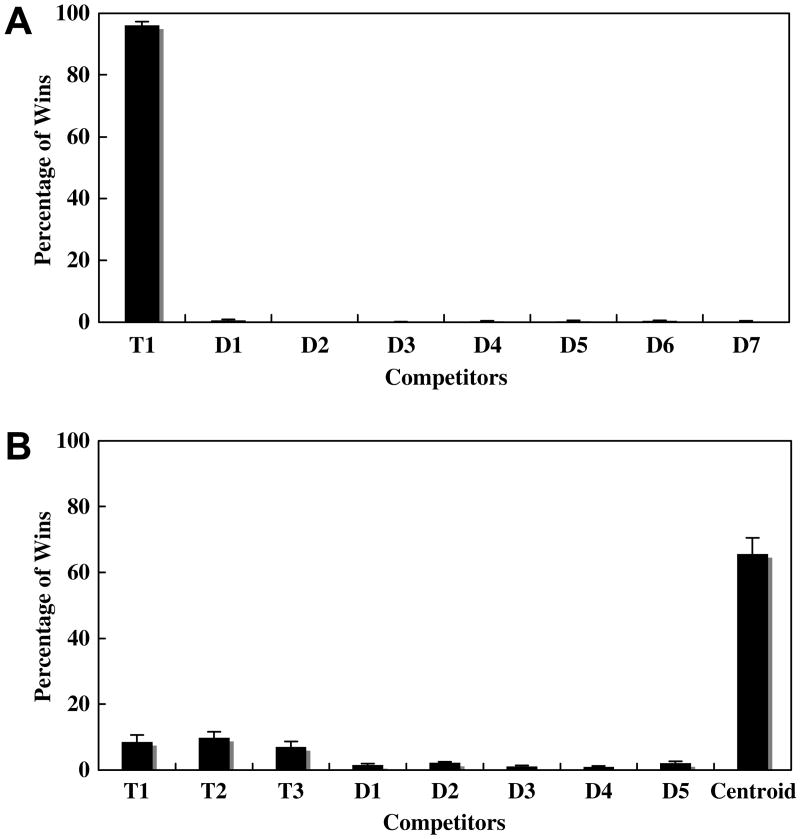
Fig. 2.
Percentage of wins for each dot. A location competition analysis was conducted that classified a dot as a winner if it was the closest to eye gaze at a given point in time. The percentage of time that each competitor was the winner is shown for (A) 1-target and (B) 3-target trials with the centroid included. Targets (T1, T2, and T3) won the competitive analysis more often than distractors (D1–D7), though the centroid won most often.

