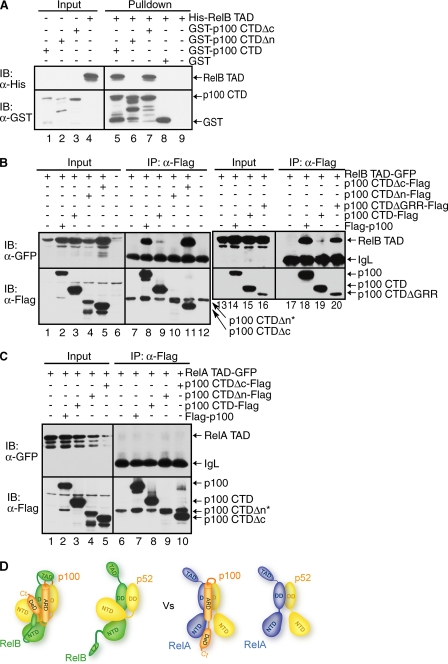
FIGURE 6.
The TAD of RelB contacts the p100 processing site. A, Western blot analysis of in vitro GST pulldown experiments showing the interaction between the TAD of RelB with the GST-tagged CTD of p100. Input and pulldown samples were separated by SDS-PAGE followed by IB. B, co-IP showing the same interaction as in A but in cotransfected HEK 293 cells. FLAG-p100 or mutants were co-expressed with RelB TAD. IPed extracts were separated by SDS-PAGE, and the presence of co-precipitated RelB was analyzed by IB (top panel). The level of p100 and p100 CTD were analyzed by IB (bottom panel). An asterisk indicates that p100 CTDΔn migrates as the same size as the IgH band. C, the TAD of RelA does not bind p100. D, model of the interactions between RelB and p52/p100 as compared with the interactions between p52/p100 and p65.

