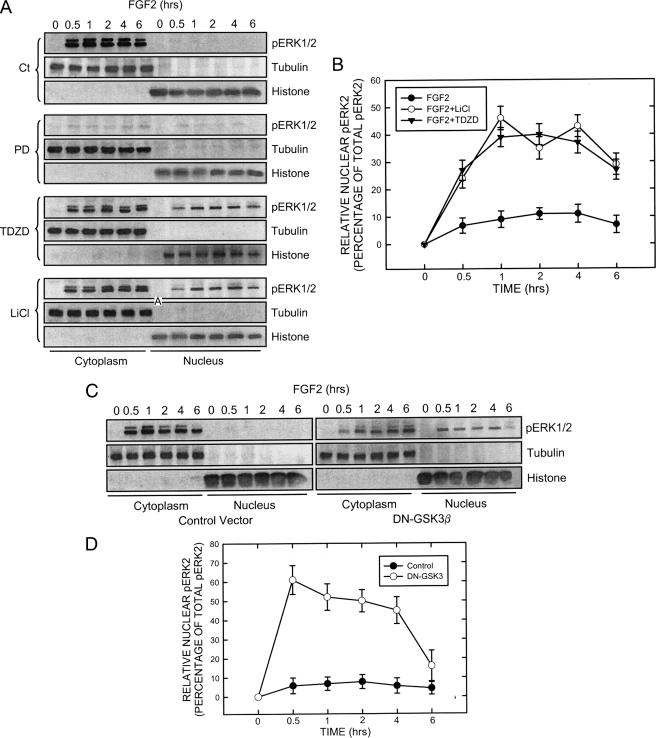
FIGURE 5.
Effect of GSK3β inhibitors and dominant negative (DN) GSK3β on the distribution of pERK1/2. A, SK-N-MC cells were maintained in serum-free medium overnight and pretreated with inhibitors of MEK1 (PD98059, 50 μm) and GSK3β (LiCl, 20 mm; TDZD, 10 μm) for 30 min. After that, cells were exposed to FGF2 (10 ng/ml) for the indicated times. The expression of phosphorylated ERK (pERK1/2) in both the cytoplasm and nucleus were examined with immunoblotting. B, FGF2-induced up-regulation of pERK2 (42 kDa) was much larger than pERK1 (44 kDa). The relative amounts of pERK2 in the nucleus were measured microdensitometrically, normalized to the level of total cellular pERK2, and expressed as the percentage of total pERK. Each data point (±S.E.; bar) is the mean of three replications. C, SK-N-MC cells were transfected with either an empty vector or a dominant negative (DN) GSK3β construct (kinase-deficient mutant) for 48 h. After that, cells were treated with FGF2 (10 ng/ml) for the indicated times. Cytoplasmic and nuclear protein were collected. The expression of pERK1/2, tubulin, and histone H3 was determined by immunoblotting. D, the relative amounts of pERK2 in the nucleus were measured microdensitometrically as described above. Each data point (±S.E.; bar) is the mean of three replications.

