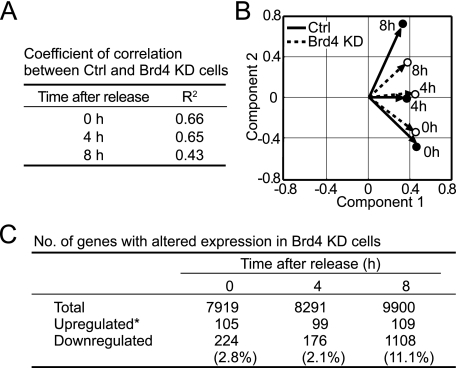
FIGURE 3.
Global gene expression patterns in control and Brd4 KD NIH3T3 cells. A, coefficient of correlation (R2) was calculated based on scatter plot analysis of microarray results. B, biplot scores for control and Brd4 KD cells at 0, 4, and 8 h were obtained according to the first two components of the principal component analysis. C, the number of genes whose expression was altered by Brd4 shRNA. *, the number of up-regulated genes listed was most likely an overestimate, since in qRT-PCR only 2 of 20 genes in this category showed higher expression in Brd4 KD cells compared with control cells. This discrepancy may be due to a normalization procedure used in this work.

