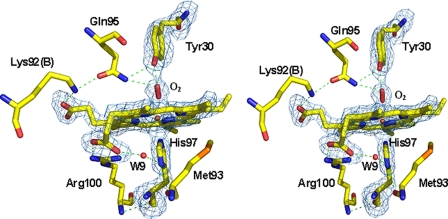
FIGURE 3.
Stereo view of the hydrogen bond network in the oxygen bound HbIILp structure. Residues at a 5-Å distance cut-off are shown. The omit map (contoured at 3 σ) and bond interactions are shown in blue and green lines, respectively. Distances between residues are shown in Table 2.

