FIGURE 1.
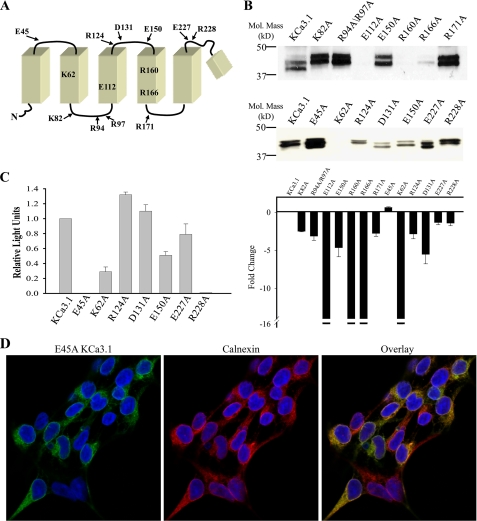
Mutation of S1–S4 charged amino acids in KCa3.1 alters channel expression and localization. A, schematic of the N terminus to the re-entrant pore loop of KCa3.1 showing relative positions of all charged amino acids mutated in the current study. B, immunoblot showing expression level of all mutations studied. Note that E112A, R160A, R166A, and K62A expressed at very low levels relative to wild type KCa3.1. 20 μg of total protein was loaded per lane. Bottom panel, average expression for the mutations in the top panel expressed as a fold-change. For E112A, R160A, R166A, and K62A expression was too low to be reliably determined and is therefore represented as a change of >16-fold (indicated by the break in the y axis) as this is the maximum change which could be detected for KCa3.1 (see “Experimental Procedures”). The average densitometries are based on three or more IBs for each mutation. C, chemiluminescent detection of cell surface localized KCa3.1 and various mutations. Data are normalized to wild type KCa3.1 and are expressed as relative light units. Note that E45A and R228A fail to express at the cell surface despite being expressed at levels similar to wild type KCa3.1 as evidenced by the IB shown in B. D, E45A KCa3.1 (green, left panel) co-localizes with the ER resident protein, calnexin (red, middle panel). Co-localization is shown as yellow in the overlay (right panel).

