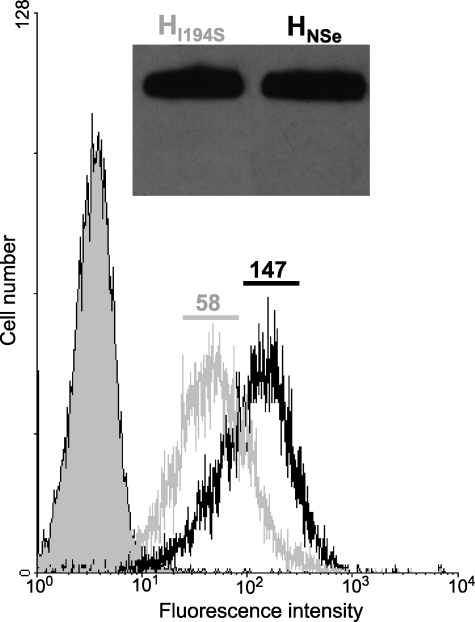
FIGURE 4.
Virus binding to cells. Virus particles were purified on a sucrose gradient, and the virus fraction was analyzed by Western blot (inset; an anti-H antibody was used). An equal number of particles of HNSe (black line) or HI194S (gray line) (as determined by densitometry) were incubated with 2 × 10⁵ B95a cells. Virus was detected with an anti-H monoclonal antibody and a PE-conjugated secondary antibody. Mean fluorescence intensity is indicated above the curve. Filled curve, control cells without virus.

