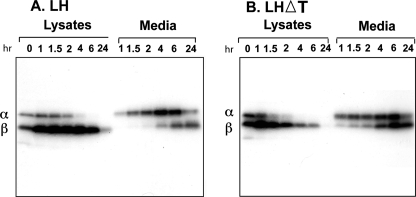
FIGURE 3.
Pulse-chase kinetics of LH (A) and LHΔT(B) dimers. GH3 cells were pulse-labeled with 80 μCi/ml [35S]cysteine for 20 min and then chased for the indicated times. Chase at 0 h indicates the lysate sample prepared immediately after the pulse. Lysates and media were immunoprecipitated with CGβ antiserum and subjected to SDS-PAGE followed by autoradiography. The migration of α and β subunits is indicated. The t½ was calculated from the appearance of the α subunit in the media, which indicates the extent of dimer formation. The data shown are representative of three independent experiments.

