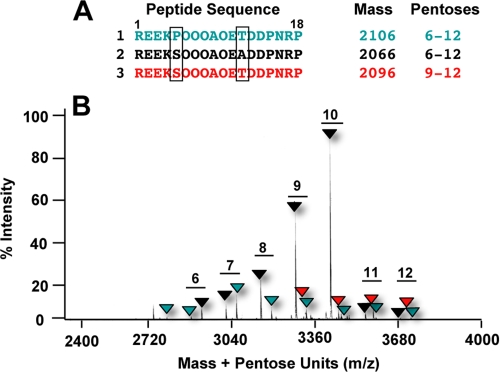
FIGURE 2.
Amino acid sequences of three glycopeptides present in the purified peak from Fig. 1C, analyzed by MALDI MS. A, amino acid sequences. The boxed residues indicate the differences among the peptides. B, MALDI MS analysis of the peptide mixture from Fig. 1C, indicating the differences in masses due to the various numbers of pentose residues present in the peptides. The masses of the peptides are color-coded to match the backbone sequences shown in panel A.

