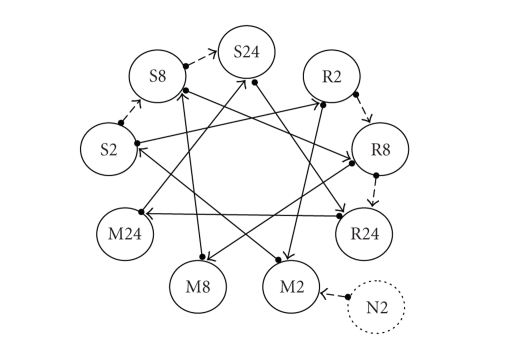
Figure 2.
Experimental design for one replicate from Zou et al. (2005). Treatments included a full 3 × 3 factorial of inoculate and time effects plus a 10th null control group at time 2 (N2). Samples indicated by circles with letters indicating inoculate assignment: bacteria resistant (R), a bacteria susceptible (S), and MgCl2 (M) control inoculate and numbers indicating time (2, 8, or 24 hours) after inoculation. Each arrow represents a single array hybridization with circle base representing the Cy3 labeled sample and tail end representing the Cy5 labeled sample. Solid arrows refer to the A-loop design of Landgrebe et al. (2006).

