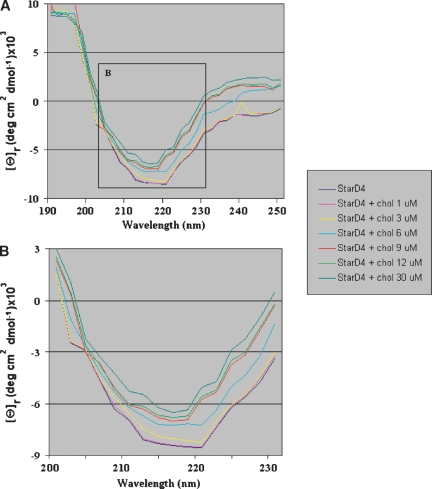
Fig. 2.
Far-ultraviolet CD spectrum of StarD4. A: The data shown are averages of three scans of the recombinant human protein StarD4 alone at 200 μg/ml (9 μM) and in the presence of cholesterol at different concentrations. B: The inset from A showing a closer look at the spectra between 200 and 230 nm of StarD4 protein alone and in the presence of cholesterol at different concentrations.

