Fig. 9.
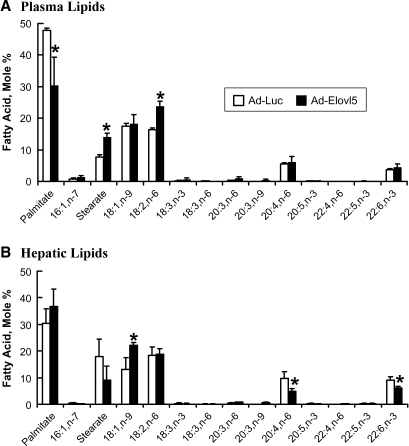
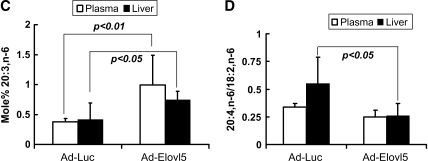
Plasma and hepatic lipid composition in animals infected with recombinant adenovirus expressing luciferase or Elovl-5. A, B: Total lipid from plasma (A) and liver (B) of fasted mice was extracted, saponified, fractionated, and quantified by RP-HPLC (17, 34). Results are expressed as mol% (mean ± SD, n = 4). * P < 0.05, fasted versus fed for either the Ad-Luc or Ad-Elovl5 group, by Student's t-test. C: Mol% of 20:3,n-6. D: Mole ratio of 20:4,n-6/18:2,n-6. Data for the graphic representation of 20:3,n-6 and 20:4,n-6/18:6,n-6 were derived from Fig. 9A, B. Results are expressed as means ± SD (n = 4). P values were calculated for Ad-Luc versus Ad-Elovl5, by Student's t-test.


