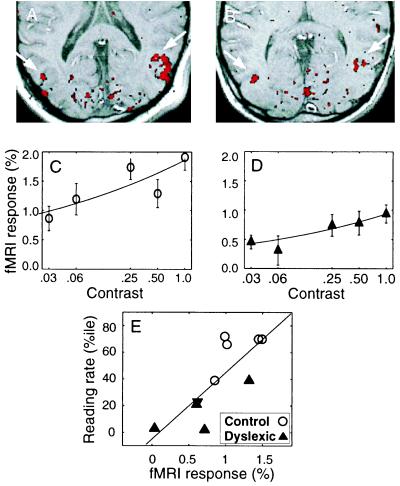
Figure 1.
FMRI responses in human cortical area MT+. (A and B) Reddish voxels show regions with greater activity to moving vs. stationary dots in a control subject and a dyslexic subject, respectively. MT+ (indicated by the white arrows) was defined to include active voxels outside the retinotopically organized visual areas. MT+ extended across three slices in both subjects, but only one slice is shown. Slices were parallel to and slightly ventral to the calcarine sulcus. (C and D) fMRI responses as a function of stimulus contrast in the two subjects. Responses were lower for the dyslexic subject (D) compared with the control subject (C). Continuous curves are fitted power functions. Error bars represent estimates of the noise in the fMRI responses. (E) Individual differences in MT+ activity are strongly correlated with individual differences in reading rate (r = 0.80, P < 0.005, one-tailed). The solid line is a regression line through the data. MT+ responses are the fitted values at 30% stimulus contrast. Reading rates are reported as percentile scores. The dyslexic subject with a high reading rate scored quite poorly on other reading measures including the reading comprehension score of the Nelson–Denny reading test.

