
FIG. 3.
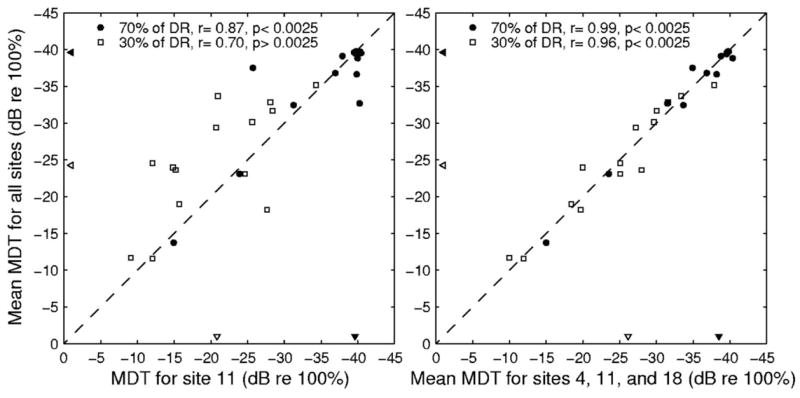
Scatterplots illustrating the correlations between mean MDTs for all sites and MDTs at Site 11 (left-hand panel) or the mean MDT for Sites 4, 11 and 18 (right-hand panel) at 70% of DR (filled circles) and 30% of DR (open squares). The filled and open triangles pointing to the abscissa represent the medians of the MDTs across all 14 subjects at Site 11 (left-hand panel) and at Sites 4, 11, and 18 (right-hand panel) for 70% and 30% of DR, respectively. The filled and open triangles pointing to the ordinate represent the medians of the MDTs across all 14 subjects at all sites for 70% and 30% of DR, respectively.