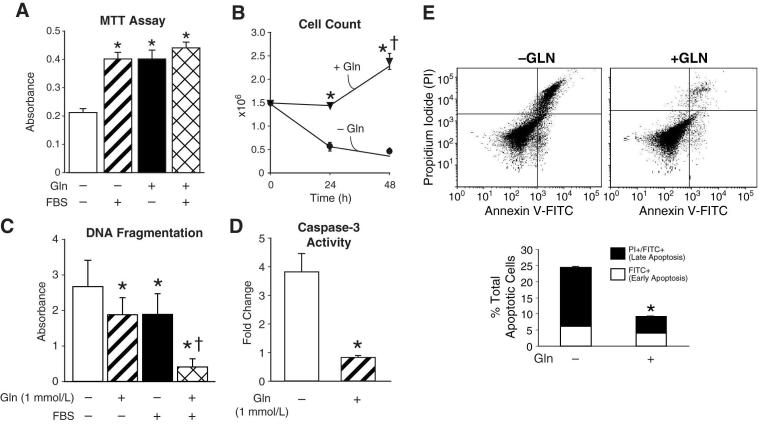
Figure 1. Glutamine deprivation reduces cell growth and increases apoptosis.
(A) RIE-1 cells were maintained in DMEM with or without glutamine (1 mmol/L) and FBS (5%). Cell proliferation was measured by MTT assay (* = p<0.05 vs. control (Gln-deprivation)). (B) RIE-1 cells were grown in the presence or absence of glutamine for 24 and 48 h. Cells were then trypsinized and counted using a Coulter Particle Counter (* = p<0.05 vs. control [Gln-deprivation] at 24 and 48 h; † = p<0.05 vs. Gln-treated at 24 h). (C) RIE-1 cells were maintained in the presence or absence of glutamine (1 mmol/L) and FBS (5%) for 24 h. DNA fragmentation ELISA was then performed as a measure of apoptosis (* = p<0.05 vs. control [Gln-deprivation]; † = p<0.05 vs. control, Gln-treated and Gln-deprived/FBS treated). (D) RIE-1 cells were maintained in the presence or absence of glutamine for 24 h. Caspase-3 activity was then measured as a marker of apoptosis. Results are expressed as fold-change compared to cells maintained in the presence of glutamine (* = p<0.05 vs. control [Gln-deprived]). (E) RIE-1 cells were maintained in the presence or absence of glutamine for 24 h. Following treatment, the total percentage of apoptotic cells were determined by annexin V-FITC staining (* = p<0.05 vs. control [Gln-deprivation]). (Results are from three separate experiments; experiments were conducted in serum-free media unless otherwise noted).

