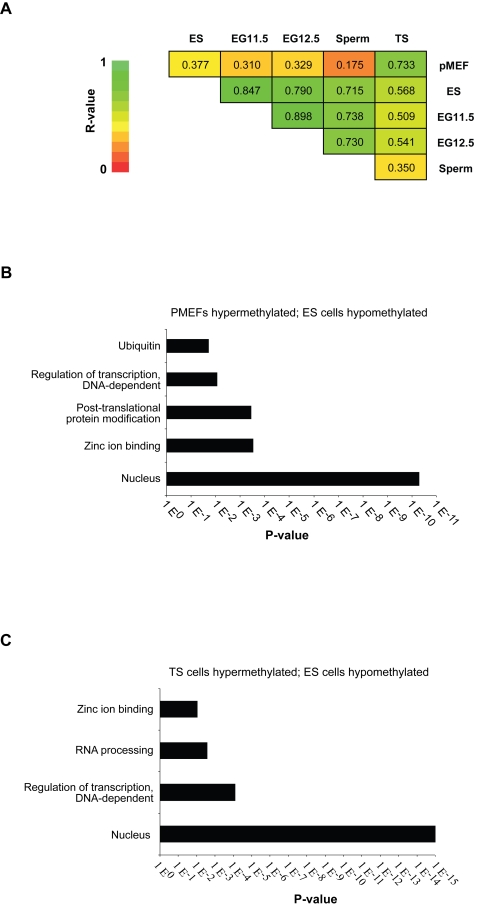
Figure 2. Global comparisons of promoter methylation patterns between cell types.
(A) Pairwise correlation comparisons were made between all cell types to establish the similarity of promoter methylation. R-values were compared for significant correlation both within and between groups, and are represented by a colour-coded scale (green is highly correlated). (B) Gene Ontology analysis for genes which are hypermethylated in pMEFs and hypomethylated in ES cells. GO terms with a significant enrichment (p<0.01) are shown. (C) Gene Ontology analysis for genes which are hypermethylated in TS cells and hypomethylated in ES cells. GO terms with a significant enrichment (p<0.01) are shown.

