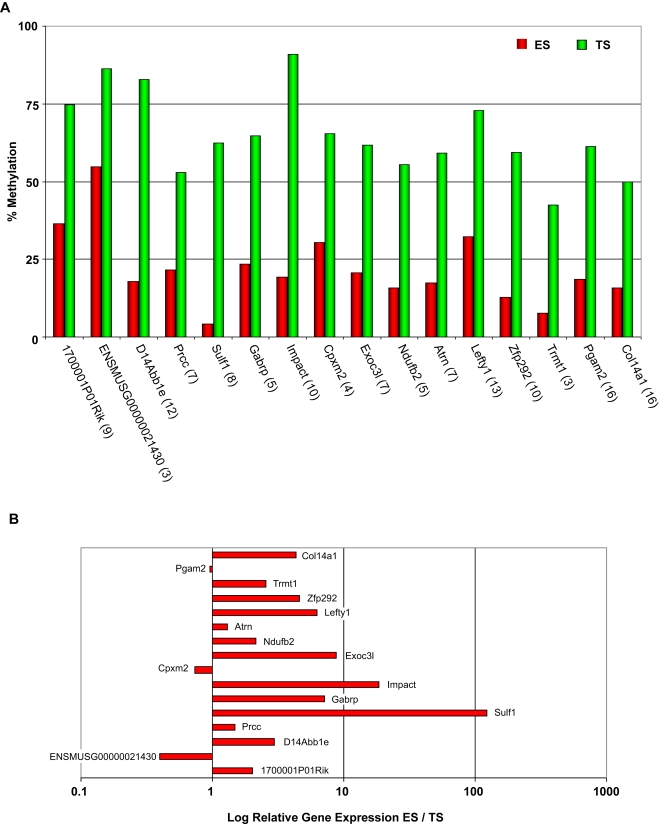
Figure 4. Promoter methylation and gene expression compared between ES and TS cells.
(A) Promoter methylation patterns in ES cells (red bars) and TS cells (green bars). Candidate promoter regions were identified by the meDIP screen and validated by Sequenom analysis. The number of differentially methylated CpGs analysed for each gene are given in brackets. (B) Gene expression differences between ES and TS cells as determined by quantitative RT-PCR analysis. The x-axis gives the log-fold expression difference between the cell types (i.e., log [ES/TS]). Three reference genes (Dynein, Pmm1 and Sdha) were used for normalization.

