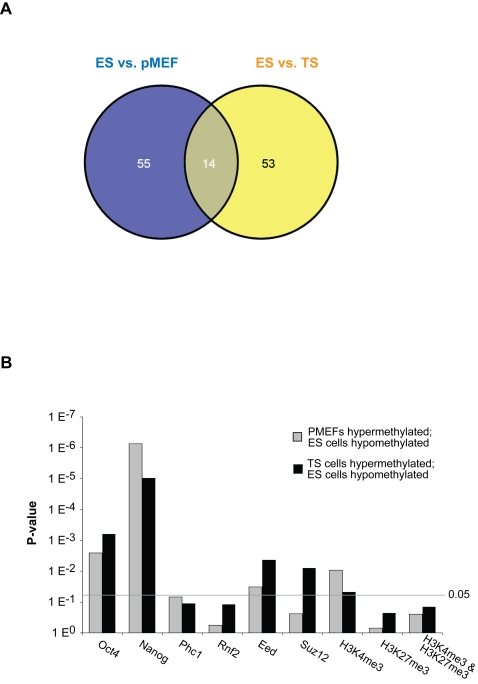
Figure 5. Global comparisons between promoter methylation and chromatin signatures.
(A) Venn diagram showing the overlapping genes between ES cell versus pMEFs (blue) and ES cell versus TS cell (yellow) datasets. 14 genes were found in common and show hypermethylation in lineage committed and differentiated cell types. (B) Comparison of differentially methylated genes in the ES cell versus pMEFs or ES cell versus TS cell dataset with ChIP datasets of Nanog/Oct4- and PcG-binding sites [43],[45], and histone H3K4/H3K27 methylation [48] in ES cells. Correlations with p-values of <0.05 are regarded as significant. Genes analyzed were all hypomethylated in ES cells and hypermethylated in pMEFs or TS cells.

